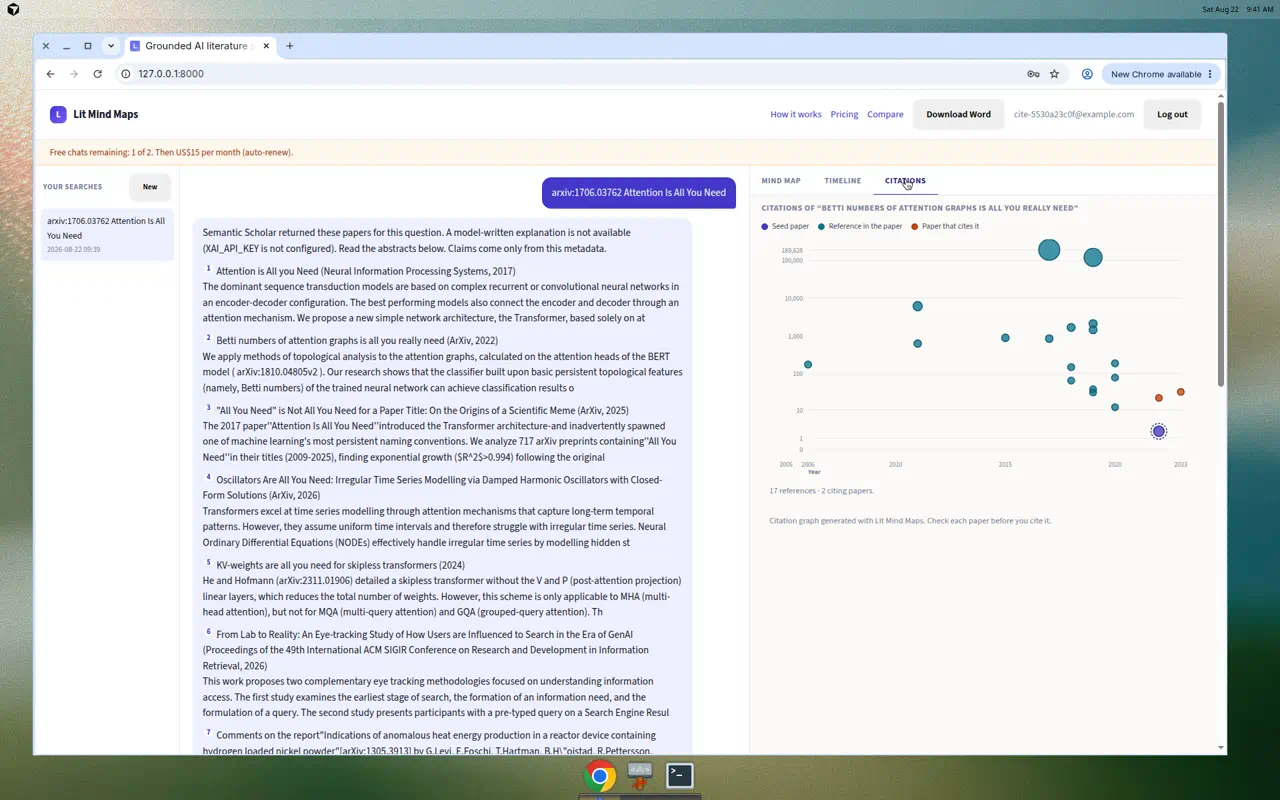
Figure 1. Citation map of a seed paper. Blue is the seed. Teal bubbles are references. Orange bubbles are papers that cite it.
What citation mapping is
Students use citation mapping to see the neighbourhood of one paper. Backward citations are the references in that paper. Forward citations are the papers that cite it. A citation graph helps you see older foundations and later work on the same idea.
Lit Mind Maps plots those papers as bubbles. A larger bubble means more citations. Click a bubble to open the paper. Use a paper chip to change the seed paper and build a new map.
How to make a citation map
- Sign in. Two chats are free.
- Paste a paper title, a DOI, or an arXiv id in the search field. You can also ask a question.
- After the search, open the Citations tab.
- Read the year axis and the citation-count axis. Hover a bubble for the title.
- Click Citation graph on another paper if you want a new seed.
Video. Open the Citations tab, read a bubble, then change the seed paper.
Citation mapping vs Connected Papers, Litmaps, and ResearchRabbit
Connected Papers, Litmaps, and ResearchRabbit are strong for related-work discovery networks. Students use them to walk a large graph of similar papers.
Lit Mind Maps is a different job. It maps the citation neighbourhood of one seed paper by time and citation count. The same search also writes a grounded answer and a literature mind map. It is not a full discovery network. See Lit Mind Maps vs ResearchRabbit, scite, and other tools.
Who it is for
- Masters and PhD students who need a citation map of one core paper
- Students who ask “who cited this paper?” or “what did this paper cite?”
- Students who also need a grounded literature search and a mind map from the same search